Multi-Target Tracking with Multi-Sensor Data Fusion
From Multi-Source Surveillance Measurements to a Unified Air Situation Picture
An ongoing systems-engineering project: software that takes surveillance measurements from several sources, decides which of them belong to the same aircraft, fuses them and maintains one continuous track per target.
Civilian Air Traffic Control is the worked example. One aircraft can be seen by several radars and can also report its own position, and each source has its own timing, geometry and error. The project brings together radar data processing, geodesy, association, state estimation, database engineering and a geographic situation display.
- Example domain
- Civilian ATC surveillance (PSR, SSR, ADS-B)
- Project scope
- Plot-level fusion of five radar sources with associated ADS-B data
- Core functions
- Association, fusion, multi-target tracking, track management
- Status
- In development; not a certified or operational ATC system
Project overview
One Picture From Many Sensors
The project combines software architecture, tracking algorithms, multi-sensor data fusion, database management and situational-awareness visualization in a single processing chain.
- Multiple surveillance sourcesPSR, SSR, ADS-B
- Data processingdecode, validate, align
- Data associationwhich data belong together?
- Sensor fusioncombine what is compatible
- Multi-target trackingpredict and update
- Track managementinitiate, maintain, end
- Unified situational pictureone track per aircraft
Conceptual flow Each stage has its own job, and the output of one stage is the input of the next.
The surveillance sources collect information about aircraft. The system processes that data, correlates observations that may come from the same aircraft, fuses the compatible information and uses tracking algorithms to create and keep one track for each target.
The wider architecture also looks at how tracks from several ATC areas could feed a central Command and Control (C2) centre that shows one consolidated air situation picture. That part is an architectural concept (see Central C2 integration).
A unified track is more than a point on a map. It is an estimate of how an aircraft is moving over time, built from many imperfect measurements and updated as new ones arrive.
Application domain
What Is Air Traffic Control?
Air Traffic Control supports the safe and efficient movement of aircraft in controlled airspace. Its general responsibilities include:
- Managing aircraft during departure, en-route flight, approach and arrival.
- Maintaining safe separation between aircraft.
- Communicating with pilots.
- Providing traffic and aerodrome information.
- Supporting aircraft in abnormal and emergency situations.
Surveillance systems give the controller information about the traffic situation. This project uses that setting as a realistic example for building and testing tracking and fusion software.
Control Tower
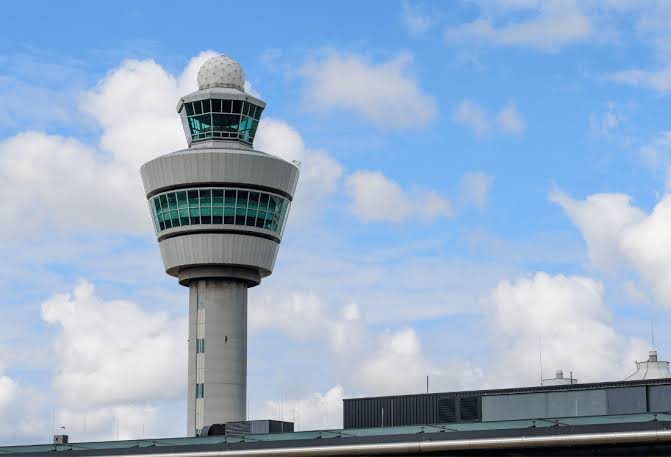
Traffic on and near the airport: runways, taxiways and the surrounding aerodrome area.
Approach Control
Arriving and departing traffic in the airspace around one or more airports.
Area Control Centre (ACC)
Aircraft flying through a larger area, typically en route between terminal areas.
Scope. This is a software-engineering and tracking project that uses ATC as its example. It is not an approved ATC system and does not provide separation or any other air traffic service.
Surveillance sources
PSR, SSR and ADS-B
Three different ways of learning where an aircraft is, each producing a different kind of data.
-
Reflection-based
Primary Surveillance Radar (PSR)
- Transmit
- Reflection
- Receive
- Detect
- Measure
PSR transmits electromagnetic energy and analyses the reflections that come back. The aircraft does not have to transmit anything for primary detection.
- Range
- Bearing (azimuth)
- Measurement time
The exact outputs depend on the radar and how its processing is built.
-
Interrogation and response
Secondary Surveillance Radar (SSR)
- Interrogate
- Transponder reply
- Decode
- Extract
SSR interrogates the aircraft's transponder and decodes the reply, together with range and bearing from the reply's timing and the antenna direction.
- Aircraft identity code
- Pressure altitude
- Additional coded information
Which items are available depends on the interrogation mode and system configuration. Not every SSR provides all of them.
-
Broadcast-based
ADS-B
- Onboard navigation
- Broadcast
- Receive
- Decode
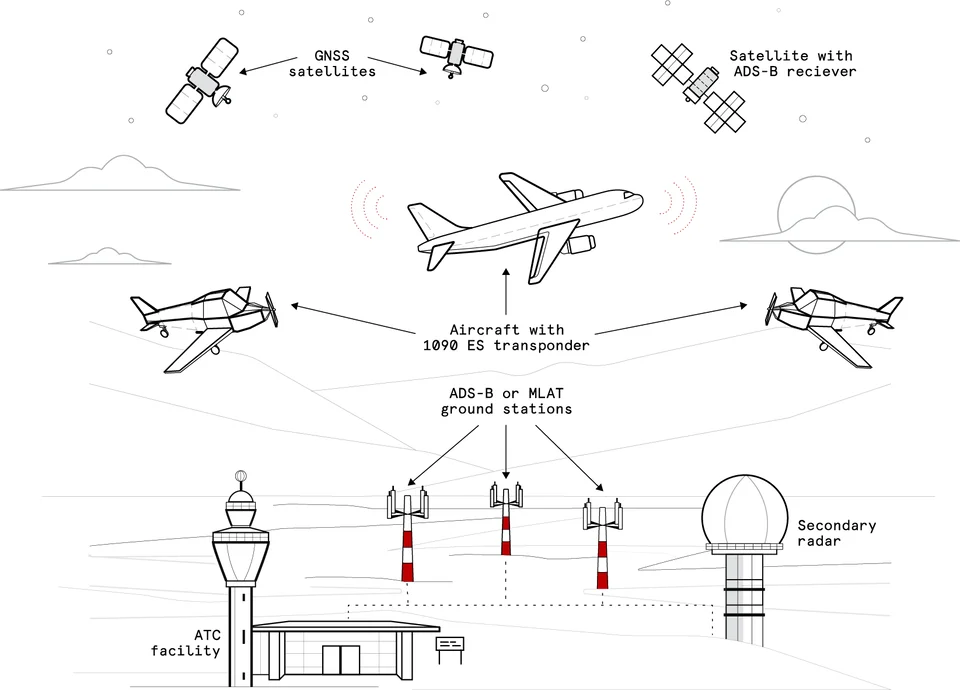
The aircraft works out its own position from onboard navigation sources and broadcasts it automatically to suitably equipped receivers.
- Automatic: sent without interrogation
- Dependent: on onboard navigation
- Surveillance: supports traffic surveillance
- Broadcast: any equipped receiver can listen
It may report position, altitude, velocity and identification, depending on the message and system configuration.
Why multiple sources matter
PSR, SSR and ADS-B differ in what they measure, how accurate they are, how often they update, whether they give an identity, where they have coverage and how uncertain their data are.
Their data cannot simply be overlaid. Before they can be combined, the system has to account for each source's coordinates, timestamps, measurement characteristics and data quality.
- PSRReflection-based surveillance
- SSRInterrogation-and-response surveillance
- ADS-BBroadcast-based surveillance
International framework
ICAO and the International ATC Framework
The International Civil Aviation Organization (ICAO) is a specialized agency of the United Nations. It develops international Standards and Recommended Practices (SARPs) and related guidance for international civil aviation. Its foundation is the 1944 Convention on International Civil Aviation (the Chicago Convention).
The SARPs are published as Annexes to the Convention. Annex 11 covers Air Traffic Services.
International aviation relies on compatible procedures and information exchange. In the same way, data from different surveillance sources has to be processed and presented consistently so that controllers get a coherent picture. That consistency is the engineering problem this project works on.
- ICAO international frameworkSARPs, Annexes and guidance
- National aviation authoritiesAdopt and regulate nationally
- Air navigation service providersProvide air traffic services
- ATC systemsSurveillance, processing and display
Simplified Simplified relationship; arrangements differ from country to country.
This project has not been certified against ICAO requirements and does not implement an Annex 11 air traffic service.
The core problem
From Measurements to Aircraft Tracks
Why this is hard
- Measurements from different sensors arrive at different times.
- Sensors use different coordinate systems.
- Each source has its own level of uncertainty.
- Several sensors may see the same aircraft.
- Aircraft may be close together.
- Measurements can be missing, noisy, delayed or wrongly associated.
- Some sources give identification while others give mainly position.
Before it can produce a reliable fused track, the system has to work out which measurements are consistent with the same physical target.
- Multiple sensor observations
- Coordinate & time alignment
- Measurement association
- Fusion
- Track update
- Continuous aircraft track
Conceptual architecture The general processing order. It is not a detailed map of the software modules.
Multi-target tracking
Keeping Many Tracks Alive at Once
Multi-Target Tracking (MTT) keeps many tracks running at the same time while it works through a continuous stream of measurements.
1 · Track initiation
Create a tentative track when observations suggest a new target.
2 · Track confirmation
Confirm the track once enough supporting observations exist, according to the configured logic.
3 · State prediction
Predict where the track should be at the next measurement time.
4 · Measurement-to-track association
Decide which observations are plausible matches for which existing tracks.
5 · Track update
Refine the estimated state using the associated measurements.
6 · Coasting
Keep a predicted track for a limited time when measurements are temporarily missing, according to the track-management policy.
7 · Track termination
End a track when its continuation criteria are no longer met.
8 · Quality & history
Keep a record of each track's continuity, quality and previous states.
Track lifecycle
Tentative
- Enters
- An observation is not associated with any existing track.
- Leaves
- Confirmed by further supporting observations, or dropped if none arrive.
Confirmed
- Cycle
- Predict, associate, update, repeated every time new data arrive.
- Leaves
- Goes to coasting when expected updates are missed.
Coasting
- Behaviour
- The track continues on its prediction alone.
- Leaves
- Returns to confirmed if a measurement is associated again, or is terminated.
Terminated
- Enters
- Continuation criteria are no longer met.
- Afterwards
- Removed from the live picture; its history can stay available for analysis.
Conceptual Generic lifecycle states. The project's own confirmation and termination criteria are not published here.
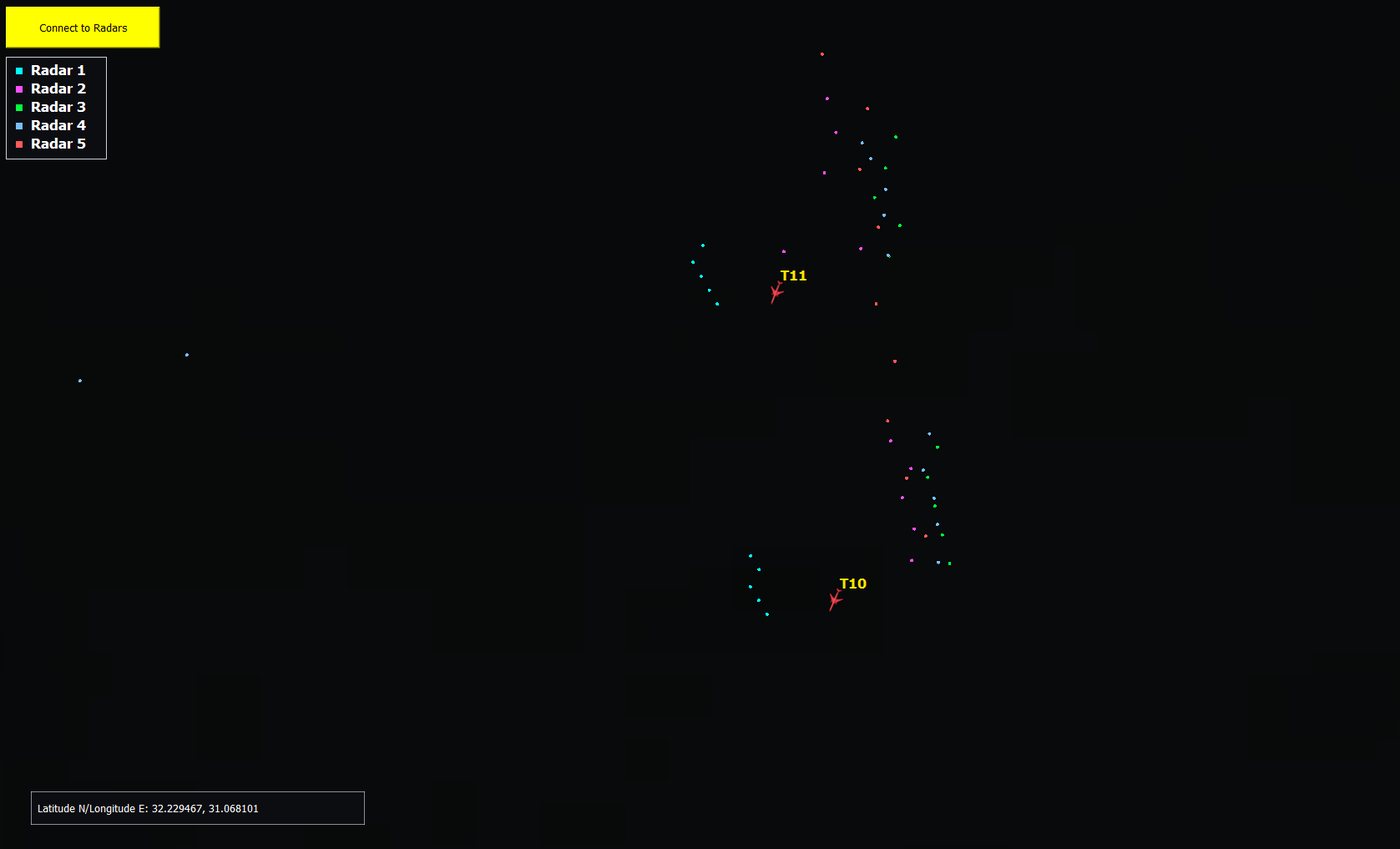
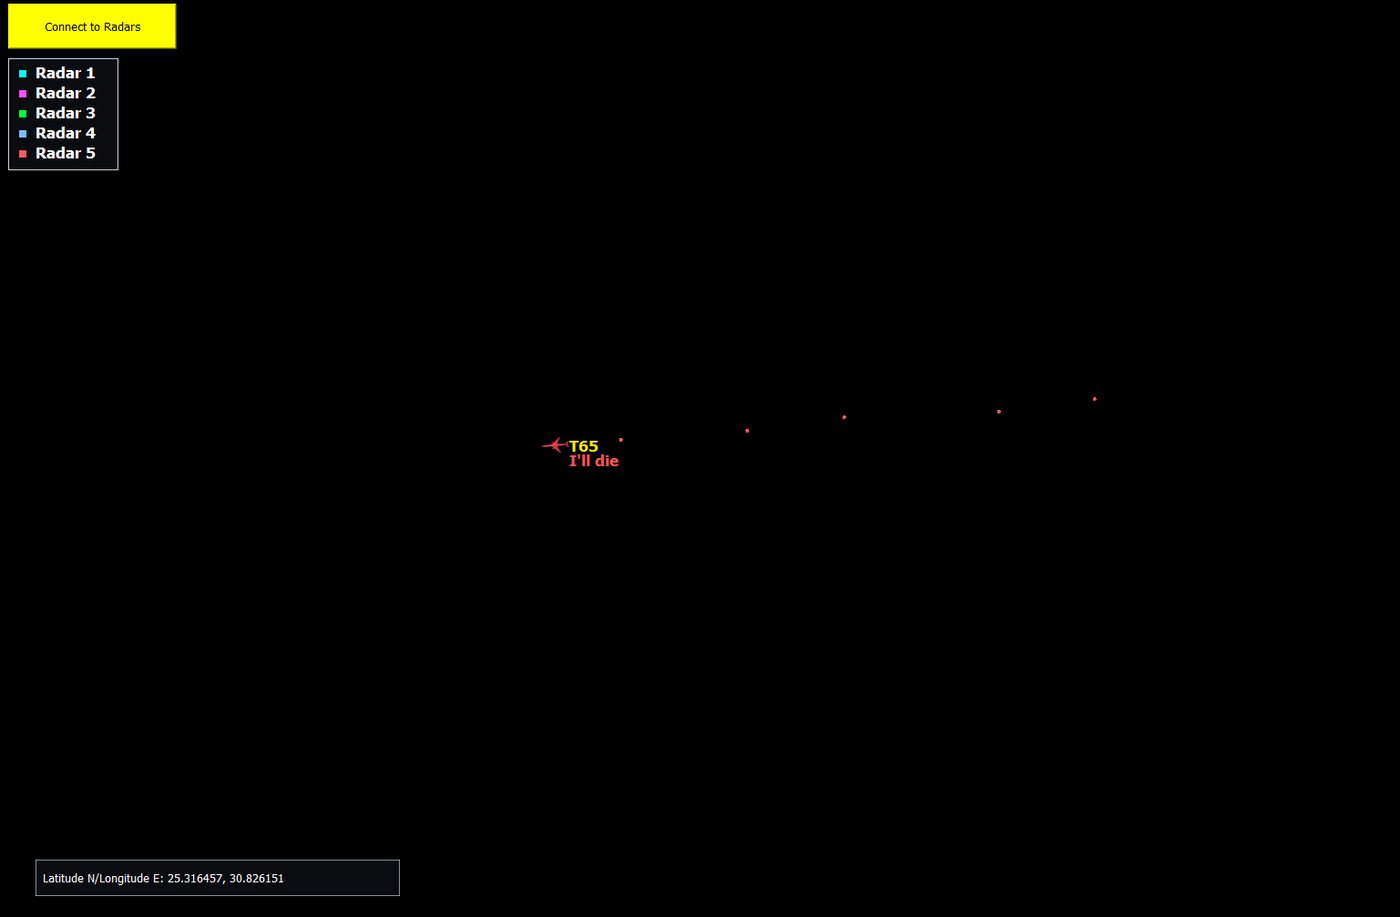
A tracker estimates quantities such as position, velocity, course and how they change over time. How available and accurate those estimates are depends on the sensor data and on the motion model chosen.
Multi-sensor data fusion
Association First, Then Fusion
Two related steps that are easy to confuse: one decides what belongs together, the other combines it.
Data association
Decides which measurements or observations may come from the same physical target. It considers time, position, sensor characteristics, measurement uncertainty and, where available, identification such as an SSR code or an ADS-B identity.
Data fusion
Combines compatible information from several sources into a more consistent estimate or representation of that target. A wrong association before fusion produces a wrong fused track, so association quality limits fusion quality.
Sources (project scope)
- Radar 1
- Radar 2
- Radar 3
- Radar 4
- Radar 5
- Associated ADS-B data
Common processing & tracking pipeline
- Receive measurements from each source
- Decode and validate input data
- Standardize measurement formats
- Align measurement timestamps
- Transform to a common coordinate frame
- Associate with tracks or other observations
- Fuse compatible measurements
- Update target states and track metadata
- Maintain track history and quality
- Publish the air situation picture
Outputs
Conceptual architecture Shows the ten processing stages in order. It is not a diagram of the actual modules and threads.
Plot-level fusion (this project's scope)
Measurements (plots) from all sensors go into one central tracker after alignment, and association and filtering are done on the raw plots. The tracker sees every measurement directly, but it has to deal with each sensor's timing, geometry and error itself.
Track-level fusion (a different approach)
Each sensor or local system runs its own tracker, and the resulting tracks are then associated and combined. The two approaches are not interchangeable: they differ in data volume, latency, how errors correlate and what each stage needs to know.
Measurement-to-track association
ConceptualWhat association has to decide
- Which plots from which radars fall near a track's predicted position at their own measurement time.
- Whether a plot is compatible with one track, several tracks or none.
- Whether an ADS-B report and a radar plot describe the same aircraft, using position, time and identity where available.
- Whether a plot that fits no track should start a new tentative track.
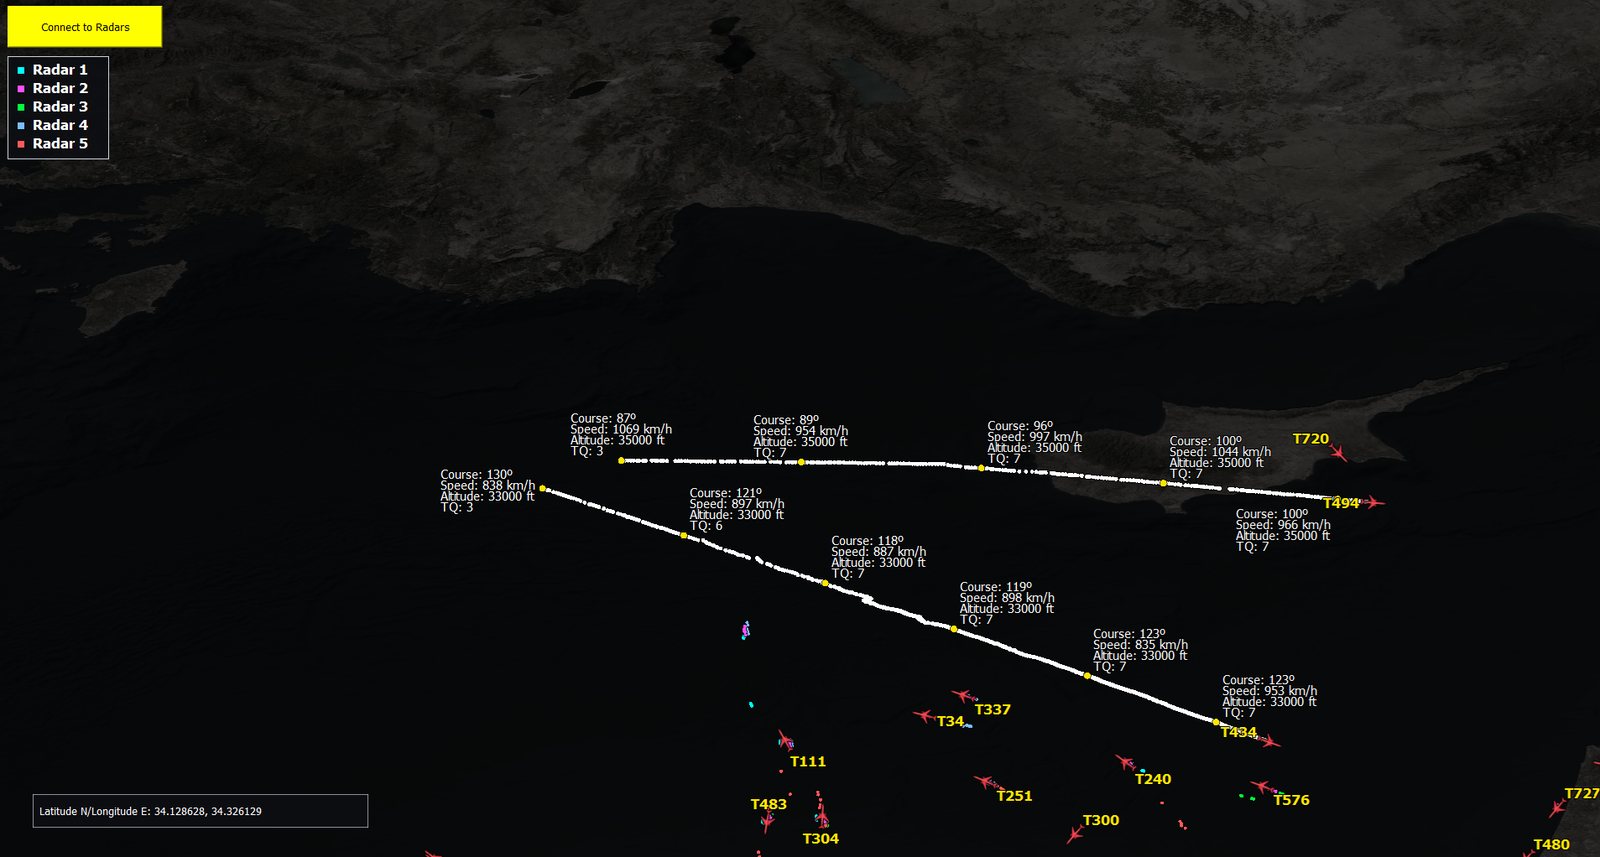
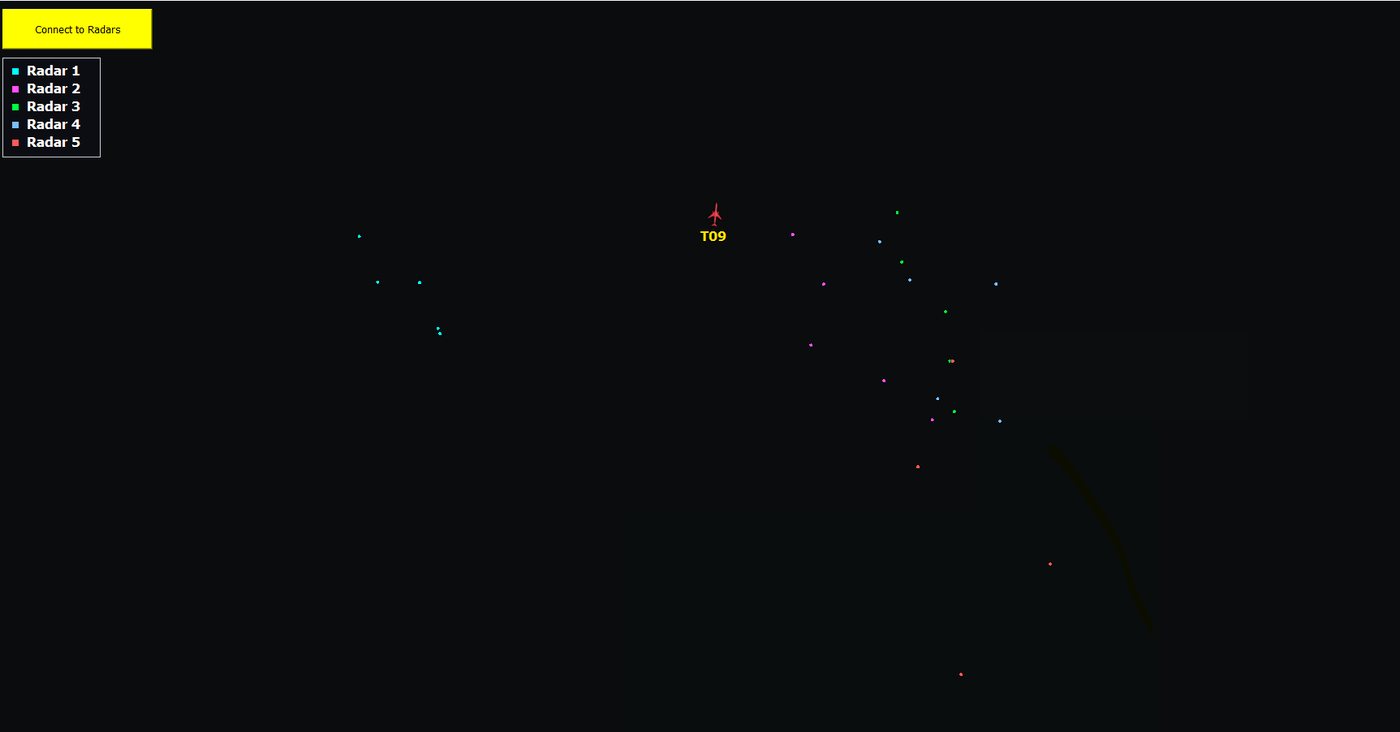
Implementation scope. The project's stated scope is plot-level fusion of five radar sources with associated ADS-B data, and the screenshots show plots from Radar 1–5 colour-coded by source. The specific association and fusion algorithms, gate sizes and thresholds are not published here, and the page does not claim the inputs are live operational feeds.
Radar data processing & geodesy
Making Measurements Comparable
Raw radar data has to be decoded, checked and converted before it can be associated or fused.
Decode range & azimuth
Extract the polar measurement from each radar record.
Altitude & identification
Process altitude and identity fields where the source provides them.
Timestamp validation
Reject or flag records with missing, out-of-range or out-of-order times.
Integrity checks
Detect corrupt, incomplete or inconsistent records before they reach the tracker.
Coordinate conversion
Convert sensor measurements into one common coordinate representation.
Sensor geometry & alignment
Account for each radar's position and alignment so plots from different sites line up.
Range corrections
Apply the appropriate range and coordinate corrections for the geometric model in use.
Quality analysis
Analyse measurement quality and inconsistencies between sources.
Polar to local Cartesian
Illustrative conventionSimplified local horizontal conversion
IllustrativeValid for the convention shown: azimuth θ measured clockwise from north, x pointing east and y pointing north. Other conventions need different formulas.
This gives positions in a flat plane around one radar. It is not a general conversion to WGS84 latitude and longitude. Combining several radar sites needs each sensor's geographic position and a proper geodetic transformation into a common frame.
Slant range vs. ground range
Flat-earth approximationA radar measures slant range R along the line of sight. The horizontal (ground) range ρ depends on the target's altitude h relative to the sensor height hs. This expression ignores Earth curvature and refraction; at longer ranges a spherical or ellipsoidal model is needed. The right correction depends on the altitude data available and the geometric model used.
State estimation
Tracking Mathematics
A simple constant-velocity model shows the predict-and-update cycle at the heart of the tracker. It is an illustrative example, not a complete specification of the models used in the project.
State vector
ExampleHorizontal position (px, py) and velocity (vx, vy) at time step k. Speed and course are derived from the velocity components. Altitude can be carried separately.
State prediction
ExampleProjects the last estimate forward by Δt. With several sensors Δt changes from update to update, because measurements arrive at irregular times.
Constant-velocity transition matrix
ExamplePosition advances by velocity × Δt, and velocity is assumed constant over the interval. Turning or accelerating targets need richer models or adaptive methods (see Projects 04 and 05).
Measurement update (Kalman form)
ExampleThe associated measurement zk corrects the prediction by a weighted amount of the residual. In a Kalman filter the gain Kk comes from the predicted and measurement uncertainties. Fixed-gain (α–β) and other recursive estimators use the same predict-update structure with different gains.
Filter types, noise settings, gate sizes and other operational parameters used in the project are intentionally not listed. The equations above are textbook illustrations of the estimation principle.
Situational awareness & HMI
More Than a Dot on a Map
Each track carries a set of information. Some of it is measured, some estimated and some reported by the source.
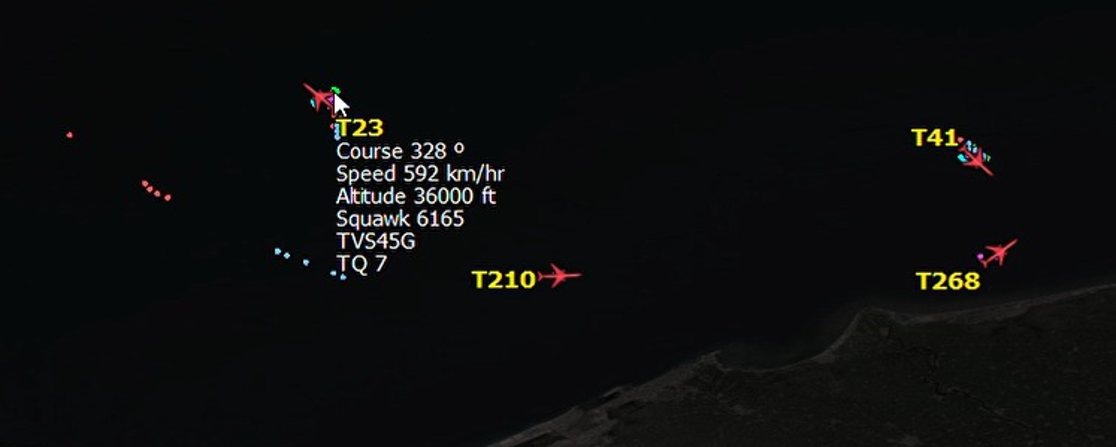
Possible track fields
- Positionestimated
- Course / headingestimated from motion
- Speedestimated from motion
- Altitudereported where available
- Squawk / identity codeSSR or ADS-B, if present
- Callsignwhen available
- Track status & qualitytracker-maintained
- Timestamptime of last update
- Track historyprevious states
Not every sensor supplies every field. A PSR-only track, for example, has no squawk or callsign. The fused label combines measurements, estimates and source-reported data.
Visualization and HMI capabilities
- Radar situation display on a geographic map Shown
- Aircraft symbols oriented along the track Shown
- Track labels with track number and expandable details Shown
- Track-history trails with periodic labels Shown
- Per-source colour coding of radar plots Shown
- Cursor latitude/longitude readout Shown
- Geographic map navigation Described
- Distance and azimuth measurement tools Described
About TQ. Labels in the project display show a TQ value, which the project uses as a track-quality indicator. In the history screenshot, the earliest points of a track show lower TQ values than the later points. TQ is defined inside this project; it is not presented here as a universal standard, and its formula is not published.
Shown visible in the project screenshotsDescribed part of the project description, not shown in the screenshots on this page
Database engineering
Large Radar Datasets, in the Right Order
Tracking can only be as correct as its input. Processing large multi-radar datasets depends on data integrity, valid timestamps, correct chronological order and efficient retrieval.
- Radar data sources
- Databasestructured radar records
- Streaming & filteringSQL, chunked reads
- Decoding
- Coordinate processing
- Fusion & tracking
- Visualization
Conceptual architecture Data path from stored radar records to the situation display.
Structured storage
Radar records kept in a database schema instead of loose files.
Efficient SQL filtering
Select only the time window, sources and fields that are needed.
Streaming, not bulk loading
Read large tables progressively instead of loading them all into memory.
Timestamp normalization
Validate and normalize timestamps so records from different radars can be compared.
Chronological merging
Merge records from several sensors into one time-ordered stream for the tracker.
Integrity & consistency
Catch duplicated, missing or malformed records before decoding.
Track history storage
Keep track states over time for later review.
Playback & analysis
Replay stored data to study track behaviour after the event.
Why chronological merging matters
Each radar produces its own time-ordered stream. A multi-sensor tracker needs one stream in true time order: if a later plot is processed before an earlier one, the prediction step runs with a negative or wrong Δt and the association decision is made against the wrong predicted position.
Conceptual Illustrative timing, not project data.
Database products, schemas, connection details, server addresses and credentials are intentionally not shown.
Software architecture
An Integrated Engineering System
The project connects data handling, mathematics, algorithms and an operator display in one processing pipeline, and each stage is validated on its own output.
- Radar data
- Database
- Decoding
- Geodesy
- Data association
- Data fusion
- Tracking
- State estimation
- Track management
- Visualization
Conceptual architecture Logical stages. The module boundaries and threading model are not shown.
- Radar records
- Database
- Streaming & filtering
- Decoding & validation
- Time alignment
- Geodesy & coordinates
- Sensor alignment
- Association
- Plot-level fusion
- State estimation
- Track management
- Situation display
- Labels & symbology
- Track history
- Measurement tools
Conceptual Layered view showing how responsibilities are separated.
Software engineering
Object-oriented, modular design. Data processing, tracking, storage and visualization are kept separate. Multithreading is used where it helps keep the application responsive, with attention to performance.
Mathematics & geodesy
Coordinate transformations, trigonometry, distance and bearing calculations, motion estimation and sensor alignment.
System integration
Connecting the components into one coherent pipeline, managing interfaces and data formats between stages, and validating each stage's output before relying on it downstream.
Recording & analysis
Track History, Playback and Analysis
Because the radar data and track states are stored, past traffic can be replayed and examined. Replay is how a tracker gets debugged and improved:
- Replay historical surveillance data.
- Watch tracks form and move.
- Examine track continuity across sensors.
- Review course, speed, altitude and track quality over time.
- Investigate data-processing and association problems.
- Support debugging, validation and further engineering work.
The project documentation describes historical track information recorded at defined intervals, for example every five minutes. That interval is an example of the intended history design, not a fixed requirement. Report generation is not covered on this page.
- Recordsurveillance data & track states
- Storetime-indexed history
- Replayin chronological order
- Inspectcontinuity, quality, association
- Improvefix, re-run, compare
Conceptual The engineering loop that recording and replay support.
See it running
Project Demonstration: ATC Multi-Target Tracking and Data Fusion
A visual overview of the multi-target tracking and multi-sensor data fusion project.
Demonstration video coming soon
The demonstration video has not been added yet or cannot be played in this browser. The rest of this page describes the system in full.
Video demonstration of the multi-target tracking and multi-sensor data fusion software.
Architectural concept
Unified Air Situation Picture and Central C2
The same principles can be applied one level up. Each ATC area processes and tracks its own surveillance data. The regional results are then exchanged and integrated at a central Command and Control (C2) centre into a consolidated situational picture.
Such an architecture could give operators a broader, consistent view of air traffic. The main engineering concerns are data exchange, interoperability between regions, consistent track identity across boundaries, time synchronization and how fresh the integrated picture is.
Concept, not deployment. Regional-to-central integration is an architectural direction of this project. It is not an implemented inter-centre capability, an operational national ATC system or a certified safety-critical service.
- Area ALocal surveillance sourcesRegional processing & tracking
- Area BLocal surveillance sourcesRegional processing & tracking
- Area CLocal surveillance sourcesRegional processing & tracking
Architectural concept
Beyond ATC
Importance and Potential Applications
Multi-target tracking, sensor fusion and state estimation are general methods. These are potential application areas for them, not deployments of this project.
Multi-radar ATC
Combining compatible measurements from several surveillance sources to keep continuous aircraft tracks.
Autonomous vehicles
Fusing GPS, IMU, camera, LiDAR and other data for vehicle-state estimation and perception.
UAV ground control stations
Combining navigation and sensor data to estimate position, velocity and heading.
Border & infrastructure surveillance
Combining several sensor sources into one consistent monitoring picture.
Counter-UAS research
Multi-sensor tracking and fusion for authorized research and defensive monitoring.
Automated C2 systems
Integrating several information sources into one situational display and decision-support workflow.
Smart cities & transportation
Combining vehicle and infrastructure data for traffic monitoring and analysis.
Engineering skills demonstrated
Nine Disciplines, One Workflow
Multi-target tracking & estimation
Track initiation, confirmation, coasting and termination; recursive predict-update estimation.
Multi-sensor data fusion
Plot-level association and fusion of five radar sources with associated ADS-B data.
Radar data processing
Decoding range, azimuth, altitude and identity; timestamp and integrity validation.
Mathematics & geodesy
Polar-to-Cartesian and geographic transforms, slant-range handling, distance and bearing.
Software engineering
Modular object-oriented design, separation of concerns, multithreading for responsiveness.
Database engineering
SQL filtering, streaming large datasets, chronological multi-sensor merging, data integrity.
Geospatial engineering
Positioning tracks on a geographic map with latitude/longitude readout and map navigation.
Visualization & HMI
Situation display, aircraft symbology, track labels, history trails and measurement tools.
System architecture & integration
Defining stage interfaces and validating each stage's output across the end-to-end pipeline.
The challenge is not any single algorithm. It is making the mathematics, algorithms, software, databases, sensor data and visualization work together as one correct workflow.
Project status & conclusion
Ongoing Work, Clear Direction
This is an ongoing project to build and demonstrate a software-based multi-sensor tracking and fusion architecture. The screenshots on this page show the current state of the display and tracking functions. Central C2 integration remains an architectural concept.
Multi-Target Tracking and Multi-Sensor Data Fusion transform measurements from multiple surveillance sources into a consistent, evolving representation of the environment. By combining data processing, coordinate transformations, association, estimation, track management, database engineering, and visualization, the project demonstrates how individual sensor observations can contribute to a unified situational picture.
Most of the engineering value comes from combining algorithm development with software integration. The project does not claim ATC certification, operational approval, national deployment or validated safety performance.
Contact & Collaboration
Working on Tracking or Sensor Fusion?
I welcome discussions about multi-target tracking, multi-sensor data fusion, radar data processing, situational-awareness systems and engineering R&D collaboration.