Planned research · not yet implemented
FUTURE PROJECT D · FIBER-OPTIC SENSINGIntelligent Fiber-Optic Intrusion Detection System (iFIDS)
Detect, locate and classify physical disturbances along an optical fiber — and test, rather than assume, whether a lower-cost interrogator can do it.
iFIDS is planned research into distributed fiber-optic vibration sensing for perimeter and critical-infrastructure monitoring: Rayleigh backscattering, Distributed Acoustic Sensing (DAS), signal processing, event localisation along the fiber, machine-learning classification and an operator-oriented monitoring interface.
It applies a pattern familiar from radar and C4I work to a new sensor: extract signals from a physical sensor, estimate what is happening, classify events, and present actionable, honestly qualified information to an operator.
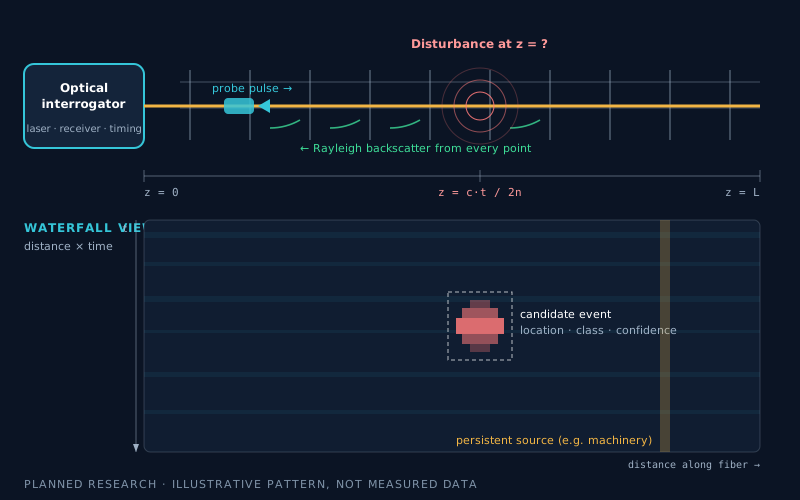
- Status
- Planned research; no interrogator, dataset or classifier has been built or tested
- Builds on
- Sensor integration, tracking & estimation, real-time C4I monitoring
- First milestone
- Software prototype on recorded DAS data: detect, locate, display
- Key open question
- Can a cost-optimised interrogator meet the dynamic-sensing requirements?
Problem & motivation
A Fiber Can Be Thousands of Sensors
Long perimeters — airports, industrial sites, pipelines, cable routes — are expensive to monitor with discrete sensors. Many already have optical fiber running along them. With a suitable interrogator, a single fiber can act as a continuous line of vibration sensors, reporting where along its length something is happening.
Commercial DAS interrogators exist but are typically costly, which limits adoption. iFIDS asks two questions in a disciplined order: first, can software reliably detect, locate and classify events from genuine distributed-sensing data; and second, can a lower-cost optical architecture provide data good enough for that software — measured against a DAS-capable reference.
Research objectives
- Understand Rayleigh backscattering and distributed acoustic sensing.
- Investigate cost-effective interrogation architectures, including the limits of OTDR-based approaches.
- Build a signal-processing pipeline to detect vibration events and estimate their fiber distance.
- Investigate ML models for classifying events from measured (and clearly labelled simulated) features.
- Develop a real-time interface: event location, class, confidence and alarm history.
- Evaluate detection, false alarms, localisation error, latency and cost per monitored kilometre.
Sensing physics
Rayleigh Backscatter, OTDR and DAS
Understanding exactly what each instrument measures is the foundation of the project — and the reason the low-cost question cannot be answered by assumption.
- A · Rayleigh backscattering
Light returns from everywhere
Microscopic refractive-index variations frozen into the glass scatter a tiny fraction of the transmitted light backward at every point. The return carries information about the fiber and its optical path.
- B · Disturbance sensing
Strain changes the return
Vibration or strain alters the returned optical signal. In coherent DAS the interrogator analyses changes in the backscattered optical field — often its phase — to recover dynamic strain along the fiber.
- C · OTDR vs. DAS
Different instruments, different jobs
A conventional OTDR measures return power versus distance to characterise attenuation, splices, connectors and breaks. A high-power pulse and a trace do not by themselves give acoustic sensitivity.
Three approaches to compare
| Approach | Role in the project | Main consideration |
|---|---|---|
| Conventional OTDR | Baseline for fiber characterisation and fault localisation | Usually not sufficient by itself for high-performance dynamic DAS |
| DAS-capable coherent interrogator | Reference system for acquiring distributed vibration data | Best reference for validating sensing and classification, but typically more expensive |
| Research-grade or custom low-cost interrogator | Experimental cost-reduction path | Must demonstrate dynamic sensitivity, range, repeatability and safe optical operation |
Proposed architecture
Distributed Sensing, Centralised Decision Support
Optical acquisition, signal processing, classification and the operator interface are kept as separate modules, so the interrogator can change without rewriting the software.
iFIDS layered architecture
Proposed designPhysical sensing layer
Optical fiber installed along a monitored perimeter or infrastructure corridor.
Optical interrogation unit
- Laser source
- Optical receiver
- Timing
- Backscatter acquisition
DAS-capable reference instrument, or the experimental low-cost design under test.
Signal processing & event detection
- Preprocessing
- Noise suppression
- Change detection
- Event segmentation
- Distance estimation
ML classification & event location
Classification
Features, classifier, confidence, unknown-event handling.
Location
Fiber distance, zone, event timeline.
Monitoring, operator review & logging
- Alarm
- Event type & confidence
- Diagnostics
- Acknowledge
- Review evidence
- Record outcome
What happens when a vibration is detected
Deviation from background
The signal departs from the current, condition-specific background model.
Locate along the fiber
Estimate fiber distance; map it to a physical location only if the route has been surveyed.
Window & features
Extract a time window and its time, frequency and spatial features.
Classify — or say "unknown"
Assign a trained category with a confidence, or report the event as unknown.
Present & store
Show location, class, confidence and the supporting signal; keep evidence for review.
Not every disturbance is an intrusion. Wind, rain, vehicles, machinery and maintenance can produce similar signals. The system must report uncertainty and never present an unverified classification as fact.
Signal-processing pipeline
From Raw Backscatter to a Reviewed Event
Each stage is independently testable and the original measurements are retained, so every alarm can be traced back to the data that caused it.
Acquire & validate
Measurements, timestamps, instrument status and distance metadata; detect missing samples, invalid values and clock problems.
Establish a baseline
Model the normal background under different conditions — never a single static baseline for every hour and weather.
Condition the signal
Filtering, detrending, normalisation and noise suppression chosen from the actual instrument output and expected bandwidth.
Detect candidates
Thresholds, rolling statistics or change-point detection find regions and intervals that differ from background.
Estimate location
Map detected position to fiber distance, accounting for calibration and the instrument's spatial response.
Features & classification
Time-domain, frequency-domain and time-frequency features into a trained model with confidence.
Validate & record
Attach confidence, preserve a source-data segment and record whether an operator confirmed the event.
Health monitoring
Separate a sensing alarm from an instrument fault, fiber break or communications failure.
Candidate features
| Feature family | Example measurements | Potential use |
|---|---|---|
| Time domain | RMS energy, peak amplitude, variance, crest factor | Distinguish stronger or more impulsive disturbances |
| Frequency domain | Spectral energy, dominant frequencies, band-energy ratios | Characterise different vibration patterns |
| Time-frequency | STFT, spectrogram features | Events whose frequency content changes over time |
| Spatial | Event extent, duration, energy across adjacent channels | Separate localised and extended disturbances |
| Temporal | Repetition rate, duration, periodicity | Distinguish recurring machinery from transient events |
Machine-learning sequence: simple first
- Model 1
Rule-based baseline
Thresholds and signal statistics. A transparent baseline that also reveals nuisance-alarm sources.
- Model 2
Classical ML
Random Forest or SVM on extracted features: do the features separate the labelled classes?
- Model 3
Time-frequency learning
A compact CNN on spectrograms or signal windows, used only if it improves generalisation.
- Model 4
Confidence & unknowns
Calibration, out-of-distribution checks and a reject class, so unfamiliar events are not forced into known categories.
Dataset discipline. Overlapping windows from the same recording must never be split randomly across training and test sets — that inflates results. Separate sessions, locations or installation conditions are reserved for testing. Every recording keeps its label, location, time, installation, sensor settings, environment and procedure. Candidate classes: background noise, controlled footstep-like disturbances, vehicle or machinery vibration, controlled digging-like vibration in an authorised area, and maintenance activity.
Mathematical foundations
Ranging, Resolution, Bandwidth and Detection
These standard relations define what any interrogator — commercial or low-cost — must achieve. Worked numbers are arithmetic illustrations using typical silica-fiber values, not instrument specifications.
Distance from round-trip time
- Distance along the fiber to the scattering point.
- Time between launching the pulse and receiving that backscatter.
- Speed of light in vacuum (≈ 3 × 10⁸ m/s).
- Group index of the fiber (≈ 1.468 for standard single-mode); the factor 2 is the round trip.
This gives fiber distance. A map position requires a surveyed fiber route, including slack loops and cable routing.
Pulse width sets how close two events can be
- Probe pulse duration. Shorter pulses resolve closer events but carry less energy, reducing signal-to-noise ratio.
Arithmetic example: ns gives 3×10⁸ × 10⁻⁷ / (2 × 1.468) ≈ 10.2 m.
Fiber length limits the sampling rate
- Sensing fiber length: the next pulse can be launched only after backscatter from the far end has returned.
- Pulse repetition rate = sampling rate of every position along the fiber.
- Highest vibration frequency recoverable without aliasing (Nyquist).
Arithmetic example: for km, ≈ 10.2 kHz, so vibrations up to ≈ 5.1 kHz are observable in principle.
Averaging trades dynamics for noise
- Fiber attenuation coefficient: the steady downward slope of an OTDR trace.
- Number of pulse returns averaged to raise signal-to-noise for a usable power trace.
Arithmetic example: averaging 10,000 returns at 10 kHz takes ≈ 1 s per trace, so any vibration faster than about 1 Hz is averaged out. Incoherent power detection is also far less sensitive to tiny strains than coherent phase detection. Whether a modified OTDR-class design can avoid both limits is exactly the research question below.
Phase change from dynamic strain
- Axial strain averaged over the gauge length.
- Gauge length — the fiber section over which phase difference is measured.
- Photo-elastic scaling factor (≈ 0.78 for silica fiber).
- Optical wavelength (e.g. 1550 nm) and fiber refractive index.
The linear phase–strain relation is why coherent interrogators can measure very small vibrations — and why laser coherence and phase stability become hardware requirements.
Adaptive background test with persistence
- Band-limited energy at fiber position and time window .
- Rolling per-position background mean and spread, updated so that weather and traffic shifts do not trigger alarms.
- Threshold and persistence; tuned on recorded data to trade detection probability against false alarms.
Proposed hardware & software
Laboratory Demonstrator First
A short, controlled fiber installation — no commercial perimeter system needs to be bought to begin the software.
- 01 · Fiber test section
Known length of single-mode fiber
Connectors and a documented route; bench first, outdoor section only once acquisition is validated.
- 02 · Optical acquisition
OTDR + DAS-capable reference
OTDR for baseline fiber characterisation; a DAS-capable instrument or a research partner's system for dynamic strain data.
- 03 · Controlled vibration source
Shaker / vibration platform
Safe, repeatable disturbances at known positions and times — the labelled ground truth.
- 04 · Processing computer
Existing Linux environment
Python signal processing, ML experiments, database and dashboard. No GPU needed for the first classical models.
Questions to resolve before buying equipment
- Does the instrument provide raw time series, complex optical data, phase — or only a conventional OTDR trace?
- Can it acquire repeated measurements fast enough for the target vibration bandwidth?
- What are its range, spatial resolution, minimum detectable strain and noise floor?
- Can it say where a disturbance occurred, not just that the total trace changed?
- Can it export timestamped measurements for independent processing?
- What optical power and laser-safety requirements apply?
Laser safety. Any experimental optical transmitter requires rated components and appropriate laser-safety procedures; high-power optical pulses can be hazardous.
Proposed software
ifids/
├── acquisition/        data_import.py · instrument_interface.py
├── signal_processing/  preprocessing.py · event_detection.py · localization.py
├── machine_learning/   feature_extraction.py · train_model.py · event_classifier.py
├── monitoring/         event_manager.py · alarm_rules.py
├── dashboard/
├── database/
├── datasets/
├── tests/
├── results/
└── README.md
| Component | Starting point |
|---|---|
| Operating system | Ubuntu Linux |
| Signal processing | Python, NumPy, SciPy |
| Visualisation | Matplotlib and PyQt5, or a web dashboard |
| Machine learning | scikit-learn; PyTorch only if a CNN is justified |
| Data storage | CSV/HDF5 for experiments; SQLite first, MariaDB or PostgreSQL for multi-user |
| Event interface | REST API or message-based when required |
| Evaluation | Reproducible scripts, confusion matrices, latency and false-alarm reports |
The central research question
Can a Cost-Optimised Interrogator Do the Job?
Research objective: evaluate the feasibility of a cost-optimised optical interrogation architecture for detecting and classifying distributed vibration events, using a DAS-capable system as the reference.
| Evaluation dimension | Question |
|---|---|
| Dynamic sensitivity | Can the low-cost architecture reliably detect the relevant disturbances? |
| Spatial resolution | Can it distinguish events at different positions? |
| Temporal bandwidth | Can it capture the time-varying signals needed for discrimination? |
| Repeatability | Does the same controlled disturbance produce consistent measurements? |
| Detection performance | Does detection remain reliable across test conditions? |
| Cost | Equipment, installation, maintenance and computing cost per monitored kilometre? |
Strategy
First obtain DAS-capable data — through a research partner, a commercial system or a documented dataset — and develop the software against it. Then evaluate independently whether a lower-cost optical implementation can reproduce the performance the application needs. This validates the processing and classification pipeline without investing prematurely in an interrogator that may not meet the sensing requirements.
Engineering challenges
- Nuisance alarms from wind, rain, traffic and machinery.
- Environmental drift of the background over hours and seasons.
- Labelled data scarcity for rare real events.
- Route mapping from optical distance to physical location.
- Data volume of continuous high-rate acquisition.
- Cybersecurity of configuration changes and event logs.
Experimental validation & performance metrics
Reporting What Matters Operationally
For critical infrastructure, false alarms are operationally important: a model with high overall accuracy can still be unsuitable if it generates frequent nuisance alarms or misses rare events.
| Metric | Definition / purpose |
|---|---|
| Precision, recall, F1 per class | Classification quality per event type, not one blended accuracy |
| False-alarm rate | False alarms per hour, or per monitored km per hour |
| Detection probability | Share of controlled events detected under defined test conditions |
| Localisation error | Estimated minus true fiber position, reported as a distribution |
| Latency | Time from disturbance to detection and to classification |
| Generalisation | Performance across environmental conditions and separate test sessions |
| Cost per km | Equipment, installation, maintenance and compute per monitored kilometre |
Deployment requirements (later stage)
- Fiber-route mapping — surveyed route translating optical distance into physical location.
- Environmental adaptation — background models for weather, traffic and normal site activity.
- Alarm management — group repeated detections into events, suppress duplicates carefully, preserve evidence.
- Health monitoring — distinguish sensing alarms from instrument faults, breaks and communication failures.
- Cybersecurity — operator authentication, protected configuration, restricted access, auditable logs.
- Human oversight — classifications stay decision support until validated for the actual site.
Phased roadmap
About Six Months Part-Time — Hardware Access Permitting
The timeline depends heavily on access to suitable optical hardware and labelled measurements. If hardware access is delayed, software work continues on documented recorded datasets.
- 01Weeks 1–3
Research & requirements
- Document DAS and OTDR principles
- Compare interrogation approaches
- Define fiber length and event requirements
- Identify a source of raw DAS data
Deliverable: requirements and technical feasibility assessment.
- 02Weeks 4–7
Offline signal-processing prototype
- Import recorded measurements
- Traces and spectrograms
- Candidate-event detection
- Distance estimation where supported
Deliverable: Python analysis application on recorded data.
- 03Weeks 8–11
Labelled dataset & ML baseline
- Controlled vibration tests or documented data
- Rule-based detector
- One classical ML classifier
Deliverable: dataset description, baseline model, performance report.
- 04Weeks 12–16
Optical hardware validation
- DAS-capable instrument or lab partner
- Sensitivity, spatial response, repeatability
- Optical measurement vs. applied disturbance
Deliverable: real-data validation and hardware feasibility report.
- 05Weeks 17–20
Monitoring interface
- Fiber route, event distance, class, confidence
- Waveform / spectrogram view
- Alarm history, data-quality and health
Deliverable: integrated iFIDS monitoring prototype.
- 06Weeks 21–24
Controlled field evaluation
- Documented fiber route
- Authorised test events + normal activity
- Detection, false alarms, location error, latency
Deliverable: demo video, results, limitations, next-stage plan.
First milestone must show four things: genuine sensing data is processed (not only simulated waveforms); controlled events are detected against background activity; false alarms and missed events are measured, not just accuracy; and there is a credible path to testing the proposed low-cost acquisition architecture.
Expected contribution
Expected Contribution & Research Direction
The potential differentiator is the combination of cost-conscious sensing research, signal-processing expertise, intelligent event classification and real-time C2-style monitoring — supported by measured results rather than claims of field readiness. A scalable design could later monitor multiple fiber segments and feed a central security or command-and-control interface, connecting naturally with my experience in real-time tracking, sensor integration and operator-oriented C2 systems.
Potential applications
- Airport and facility perimeters
- Critical infrastructure and industrial installations
- Pipeline and cable-route corridors
- Other environments needing distributed disturbance monitoring

Mohammed Ismail Ali Attala
Senior Systems Engineer · C4I/C2 Integration · Tracking & Navigation
Seeking research partners with DAS-capable instruments, datasets or authorised test sites.
Contact & Collaboration
Working with Fiber Sensing or Perimeter Security?
I welcome discussions with research groups, instrument suppliers and infrastructure operators about distributed sensing, signal processing and event classification.