Single-Radar Multi-Target Tracking
From Radar DSP Measurements to Continuous Target Tracks
Designed and implemented a single-radar multi-target tracking (MTT) system that interfaces directly with radar digital signal processing (DSP) outputs. The system receives radar plot data containing range measurements and azimuth information associated with Azimuth Counter Pulses (ACP) and Azimuth Reference Pulses (ARP). It processes these measurements through track initiation, state prediction, and plot-to-track data association to maintain continuous target tracks and update their kinematic parameters.
The system also maintains a historical database for each track, storing time-stamped position, velocity, and heading information. These histories support playback, post-event analysis, and report generation.
- Sensor
- One radar; processed DSP plot output
- Measurements
- Range, with azimuth from ACP / ARP
- Track output
- Continuous tracks with position, velocity and heading
- History
- Per-track, time-stamped records for playback and analysis
Objective
Project Overview
This project implements a single-radar multi-target tracking system capable of processing measurements from one radar sensor to establish and maintain tracks for multiple moving targets. The system converts incoming radar plots into continuous track estimates, supporting real-time visualization and subsequent historical analysis.
The tracker sits after the radar's signal processor: it works with detections that the DSP has already extracted, and its job is to turn those scan-by-scan detections into a coherent picture of who is where, moving in which direction, and how fast.
Key capabilities
-
01
Radar DSP data interface
Receives processed plot data directly from the radar's DSP output.
-
02
Range & azimuth processing
Interprets range and derives azimuth from ACP / ARP information.
-
03
Track initiation & lifecycle
Creates candidate tracks, confirms, maintains and removes them.
-
04
Prediction & association
Predicts track states and matches new plots to existing tracks.
-
05
Kinematic estimation
Maintains estimates of position, velocity and heading for each track.
-
06
Per-track history
Stores time-stamped kinematic records over each track's lifetime.
-
07
Playback & post-event analysis
Replays recorded tracks to reconstruct and examine past motion.
-
08
Visualization & reporting
Displays current and historical tracks and supports analytical reports.
How the parts connect
System Architecture
Processing runs along two paths: a real-time tracking path that turns each incoming plot into updated track states, and a historical path that stores those states for later playback, visualization and reporting.
- 01
Radar DSP Output
Plot measurements received from the radar signal processor.
- 02
ACP / ARP Azimuth Processing
Antenna position and reference resolved into plot azimuth.
- 03
Plot Formation & Time Tagging
Range, azimuth and time combined into a usable plot.
- 04
Track Initiation & Management
Unassociated plots evaluated; track lifecycle maintained.
- 05
Prediction & Plot-to-Track Association
Plots matched against predicted track states.
- 06
Track Update & Kinematic Estimation
Position, velocity and heading refined.
Updated track states feed the next prediction cycle, and active tracks are presented on the real-time display.
- 07
Historical Track Database
Separate time-stamped record kept for each track.
- 08
Playback, Visualization & Reporting
Reconstruction, review and analytical reports.
Step by step
How the Tracking System Works
Ten steps take a measurement from the radar's signal processor to a stored, replayable track.
- Input
Receive Radar DSP Data
Receive processed radar plot measurements containing range and azimuth-related information derived from ACP and ARP.
- Input
Form and Pre-Process Plots
Interpret the incoming data, attach the relevant time information, and prepare the measurements for tracking.
- Tracking
Initiate New Tracks
Evaluate plots not associated with existing tracks, and establish candidate tracks when the configured initiation conditions are met.
- Tracking
Predict Existing Track States
Estimate the next expected state of each active track from its previous state and the elapsed time interval.
- Tracking
Perform Plot-to-Track Association
Compare incoming plots with predicted track states and select suitable associations according to the implemented correlation logic.
- Tracking
Update Track States
Refine position, velocity and heading estimates using the associated observations.
- Tracking
Manage the Track Lifecycle
Confirm, maintain and remove tracks according to the configured track-management rules.
- History
Store Historical Track Data
Save time-stamped kinematic information for each track.
- Analysis
Replay and Analyze Historical Tracks
Use the stored history to reconstruct movement and examine past track behaviour.
- Analysis
Visualize and Generate Reports
Present current or historical tracks and produce analytical reports where supported by the implementation.
Input stage
Radar DSP Interface and Plot Processing
The tracking application does not process raw radar echoes. It receives processed plot information from the radar's Digital Signal Processing unit, which has already detected targets, and builds tracks from those plots.
What each plot carries
- RANGE
Range: the measured distance from the radar to the detected target.
- ACP
Azimuth Counter Pulses: pulses generated as the antenna rotates, indicating its angular position.
- ARP
Azimuth Reference Pulse: the reference used to align azimuth, marking the antenna's passage through the reference direction.
- TIME
Time information: preserves the temporal order of measurements so that motion can be estimated.
From DSP output to a usable plot
- Receive the radar DSP output.
- Interpret the range measurement.
- Use ACP and ARP information to determine the plot's azimuth.
- Associate the measurement with its scan or observation time.
- Form a usable radar plot for the tracking process.
Development and test input: DSP Simulator
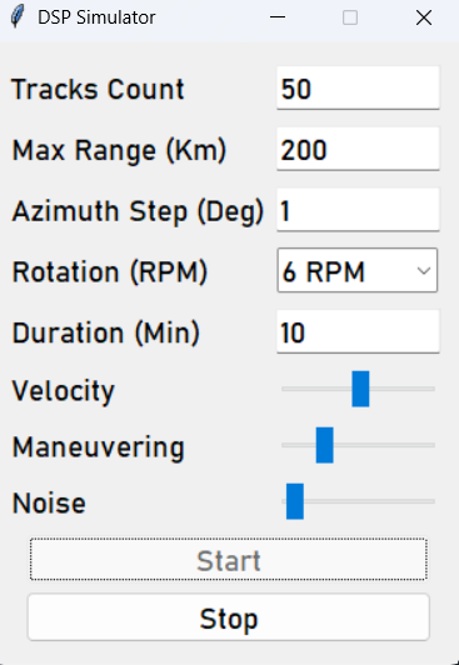
Alongside the tracker, the project includes a DSP Simulator that generates synthetic radar plot streams. It lets the tracking software be exercised without a live radar, under scenarios configured by the engineer.
The simulator window exposes these scenario parameters:
- Number of tracks
- Maximum range
- Azimuth step
- Antenna rotation rate
- Scenario duration
- Target velocity
- Manoeuvring level
- Measurement noise
The values visible in the screenshot are simulation settings for a test scenario. They are not specifications of an operational radar.
Track management
Track Initiation and Lifecycle Management
Every incoming plot must be judged: is it a new target, or another observation of a target that is already being tracked? Track management keeps tracks continuous while limiting false tracks and obsolete entries.
- Stage 1
Track initiation
Establish a candidate track from suitable measurements that do not belong to an existing track.
- Stage 2
Track confirmation
Decide whether the candidate has enough supporting observations to become an established track.
- Stage 3
Track maintenance
Keep updating the active track as new plots are associated with it.
- Stage 4
Track loss handling
Handle missed observations and targets that are no longer being detected.
- Stage 5
Track deletion
Remove tracks that are no longer considered active under the configured rules.
Confirmation thresholds, missed-observation limits and deletion rules are configurable, implementation-dependent parameters. Specific values are not given on this page.
The core tracking problem
State Prediction and Data Association
Each active track has an estimated state built from its previous observations. Before the next measurements arrive, the system predicts where each target should appear, and uses those predictions to decide which new plot belongs to which track.
- A · Predict
Estimate the next target state from the previous track state and the time interval since the last update.
- B · Associate
Compare new radar plots with the predicted track states and determine which plots are plausible matches.
- C · Update
Use the associated observation to refine the corresponding track's state.
Why data association matters
- Maintains continuity of each track across radar scans
- Reduces incorrect plot-to-track associations
- Limits track swaps when targets pass close to each other
- Handles multiple targets moving in different directions
- Supports dependable tracking over time
Association is applied according to the system's implemented correlation logic. Like any tracker, its outcome depends on target density, measurement quality and scenario conditions.
Measurement vs. estimate
Continuous Track Updates
When a plot is associated with an existing track, the system updates that track's estimated state and records the observation time. The tracker is designed for real-time operation, so each update happens as new plots arrive.
- PositionCurrent estimated location
- VelocityEstimated speed of motion
- HeadingEstimated direction of motion
- TimestampTime of the latest update
Measured radar plot
A single detection reported by the radar DSP: a range and azimuth at a particular time. Individual plots contain measurement noise.
Predicted track state
Where the track is expected to be at the time of the new measurement, projected forward from its last estimate.
Updated track state
The refined estimate after combining the prediction with the associated plot, carrying position, velocity and heading.
Beyond real time
Historical Track Database
The system maintains a separate historical record for each track, storing time-stamped kinematic information throughout the track's lifetime. This history supports reconstruction of target motion and provides the foundation for playback, post-event analysis, and analytical reporting.
Recorded fields
- Track identifier, where available
- Position
- Velocity
- Heading
- Timestamp
The storage engine, schema and file format are implementation details and are not described here.
Track history: one track, successive updates
Illustrative Example — Not Actual Operational Data| Track ID | Timestamp | Position (R / Az) | Velocity | Heading |
|---|---|---|---|---|
| T-EX01 | t₀ | R₁ / Az₁ | v₁ | h₁ |
| T-EX01 | t₀ + Δt | R₂ / Az₂ | v₂ | h₂ |
| T-EX01 | t₀ + 2Δt | R₃ / Az₃ | v₃ | h₃ |
| T-EX01 | t₀ + 3Δt | R₄ / Az₄ | v₄ | h₄ |
| T-EX01 | t₀ + 4Δt | R₅ / Az₅ | v₅ | h₅ |
Symbolic placeholders are used deliberately: no real ranges, bearings, speeds or times are shown. Δt is the interval between successive updates.
Post-event analysis
Track History, Playback, and Analysis
Because every update is stored with its timestamp, a track's motion can be reconstructed and stepped through after the event, rather than only observed live.
Record 1 / 12
What recorded history supports
- Reconstruction of target movement over time
- Playback of historical tracks
- Examination of track behaviour at selected times
- Post-event technical analysis
- Mission debriefing and incident investigation
- Generation of analytical reports
Presenting the picture
Visualization and Reporting
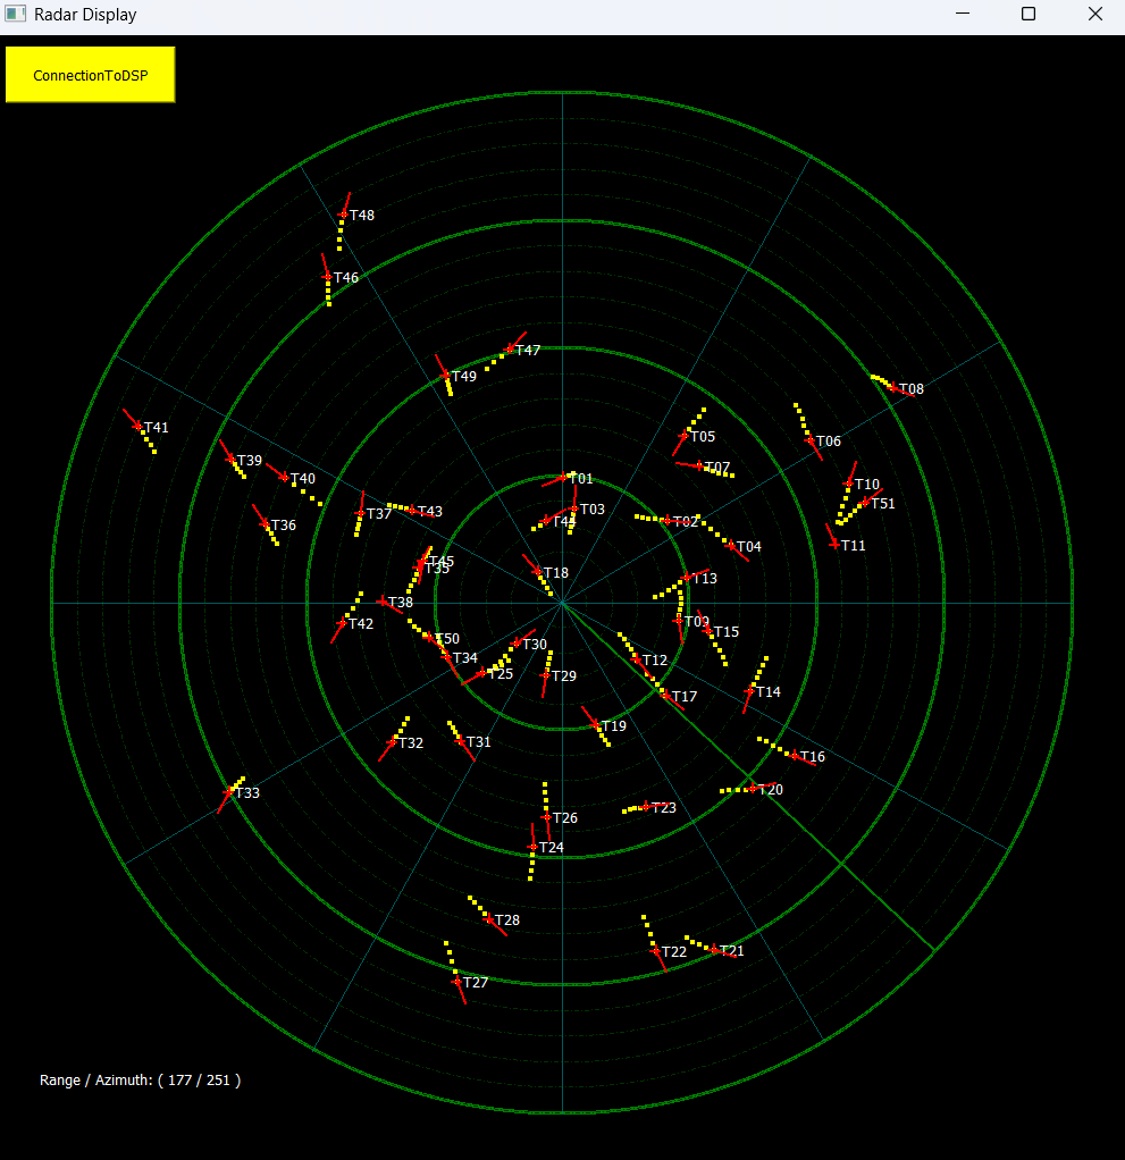
Current and historical track information is presented so that operators and engineers can follow targets live and review them afterwards.
Visible in the screenshot
- Shown
Real-time display of active tracks on a radar plan-position view with range rings and azimuth spokes. - Shown
Track identifiers (T01, T02, …) labelling each track. - Shown
Position and movement: a short trail of recent positions and a line showing each track's direction of motion. - Shown
Cursor readout of range and azimuth, and a control for the DSP connection.
Described capabilities
- Described
Historical playback on suitable map or radar displays. - Described
Review of stored track histories. - Described
Analytical report generation and export where supported by the implementation.
See it running
Single-Radar Multi-Target Tracking — Video Demonstration
Demonstration video coming soon
The demonstration video has not been added yet or cannot be played in this browser. Please check back later.
This video demonstrates the single-radar tracking application and its main capabilities.
Contact & Collaboration
Interested in Radar Tracking Work?
I welcome discussions about radar tracking, track management, sensor data processing and systems integration, as well as engineering R&D collaboration.